
Research Terminal
One stock, one page,
and a plan you can be held to.
Everything the decision needs in one place — and then the written plan that comes out of it.
One page per stock
Everything the decision needs, in the order you need it.
The company, the quick numbers, your own position in it, and what this page is waiting on you for.
- Action Center
- Company Overview
- Quick Glance
- Current Positions
The chart
Your plan's levels, listed right under the chart.
Entry zone, add, stop, warn level and all three targets stay beside the chart and match the plan below.
Price levels
Every level that matters, and why it is there.
Support and resistance with the evidence stacked behind each one — prior closes, moving averages, volume shelves, option walls — so a level is a reason rather than a line someone drew.
Fit, record, risk
Whether this trade suits you, not just whether it looks good.
The Trade Fit Analyzer scores the setup against your style and your journal. In this sample, Long Swing Breakout Anticipation (Coil) is the highest-ranked expression; the setup, sizing, strategy, and edge panels all evaluate that same selected scenario.
- 84% Long Swing setup
- 62% of maximum risk size
- 91% Breakout Anticipation match
- 72% selected-play edge
Street and regime
Where this name sits in the wider picture.
Analyst consensus, the macro conditions that move it, its regime and relative performance, and how the session has treated it.
- Analyst Consensus
- Macro Conditions & Impact
- Market Regime & Relative Performance
- Session Performance & Gaps
Volatility and flow
How far it moves, and who is moving it.
Implied volatility against its own history, moving-average structure, and the institutional prints behind the tape.
- Implied Volatility
- MA Crossover Analysis
- Dark Pool Activity
Timeframes and smart money
Whether the signals agree with each other.
One matrix across every timeframe, and a ledger of the positioning behind the price.
Squeeze, options, momentum, catalysts
The four things that turn a good chart into a bad week.
Short data and borrow, unusual options premium, momentum extremes, and anything with a date on it.
- Short Data & Squeeze
- Unusual Options
- Momentum Oscillators
- Catalysts & News
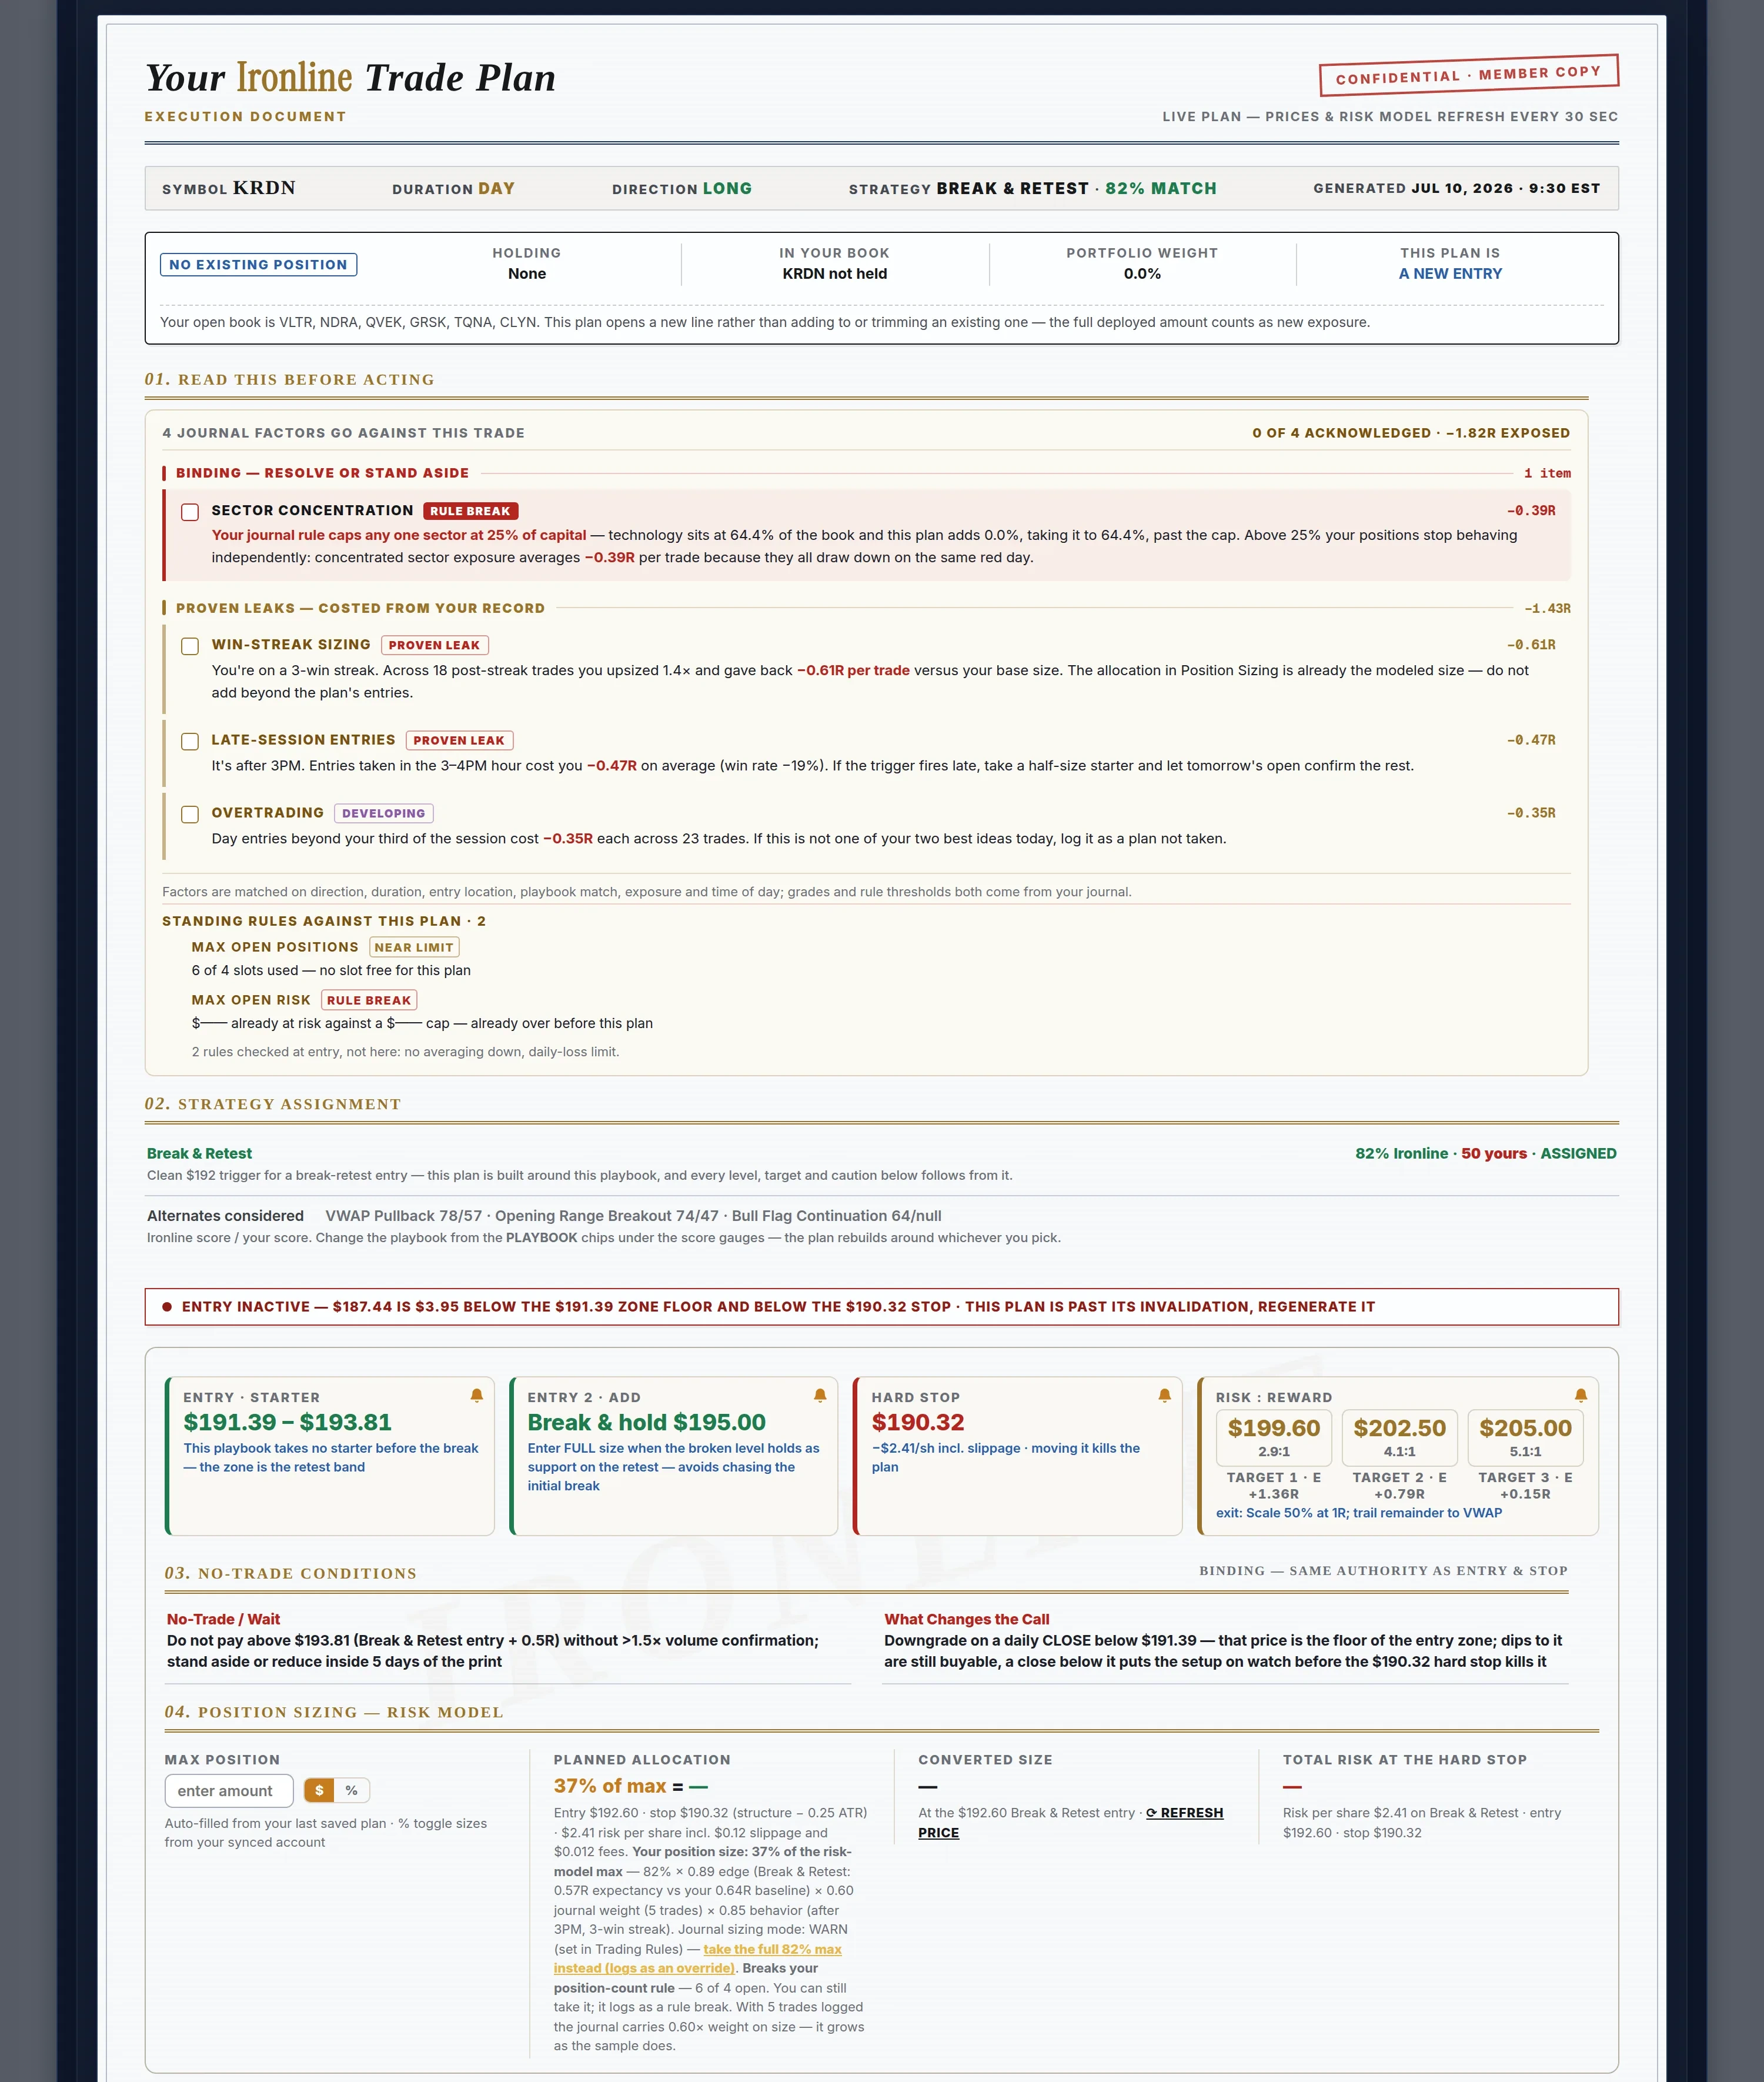
The written plan
A plan you can be held to, written before the money is on it.
What to read before acting, the strategy this setup is assigned to, the conditions that forbid taking it at all, the size the model allows, and the events between now and the exit.
- Read This Before Acting
- Strategy Assignment
- No-Trade Conditions
- Position Sizing — Risk Model
- Timing & Events
Position sizing
The size is calculated, not chosen in the moment.
Entry, stop and the risk per share give the model size. Your edge in this playbook, the weight your journal has earned, and how you have been behaving today each move it from there — and the card shows every one of those factors rather than just the answer.
Price Ladder Long / Short
Every level, in the order price will meet them.
Targets, the breakeven stop move, the trail, both entries and both stops — each with what it means, what to do there, and how many separate pieces of evidence sit on that price.
Pre-flight
The checks that stand between the plan and the order.
The plan cannot be logged until the checklist is cleared and any rule it breaks is acknowledged in writing.
Position sizing
How Ironline calculates position sizing by risk factors.
Inputs are weighted for the trade’s direction and holding period. Portfolio limits and journal evidence can reduce the calculated size.
- Trade direction, intended holding period, and selected playbook
- Entry price, structure-based stop, risk per share, slippage, and fees
- ATR and daily range, volatility, implied volatility, beta, and 52-week range position
- Liquidity, spread, volume, float, and halt risk
- Market regime and performance, relative strength, sector performance, and gaps
- Earnings proximity, dated catalysts, macro conditions, and same-day events
- Short interest, squeeze and borrow risk, unusual options, and carry costs
- Analyst context, news, sentiment, and current market flow
- Account equity, maximum-position setting, open risk, and risk left
- Open-position capacity, current sector exposure, and concentration limits
- Journal-backed playbook results, sample size, and evidence confidence
- Time of day, streaks, saved risk rules, and any recorded sizing override
A plan is only worth what you do with it.
Logged plans become trade cards, and closed trades become the analytics that tell you which of them were worth taking.